Market
|
Step 1: Go to app.pseconnect.com and LOGIN your account
|
|

|
|
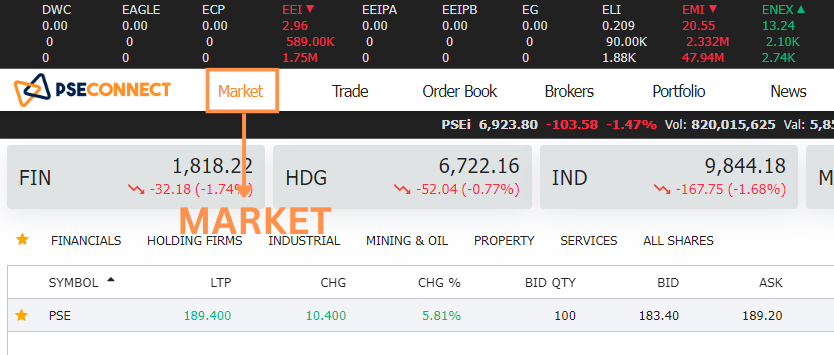
Step 2: Navigate to MARKET |
|
Ticker displays the trade matching as it happens on the market. The display on the ticker is based on the 2 market phase, namely the Market Open and Market Close phase. Market Open ticker displays the executed time, stock symbol, matched price, matched quantity, buying broker house (BBH) and selling broker house (SBH). On the other hand, the Market Close ticker displays the stock symbol, stock price, total volume and total value. |
|
Market Open Ticker Display |
 |
|
|
Market Close Ticker Display |
 |
|
|
1. PSEi Report 2. Market Phase 3. Current Date 4. Current Time |
|
|
|
Index Report displays the total volume, total trades, total value, number of advances, number of declines, and number of change for each index. |
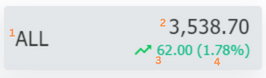 |
1. Index 2. Index Level 3. Index Change 4. Index Change % |
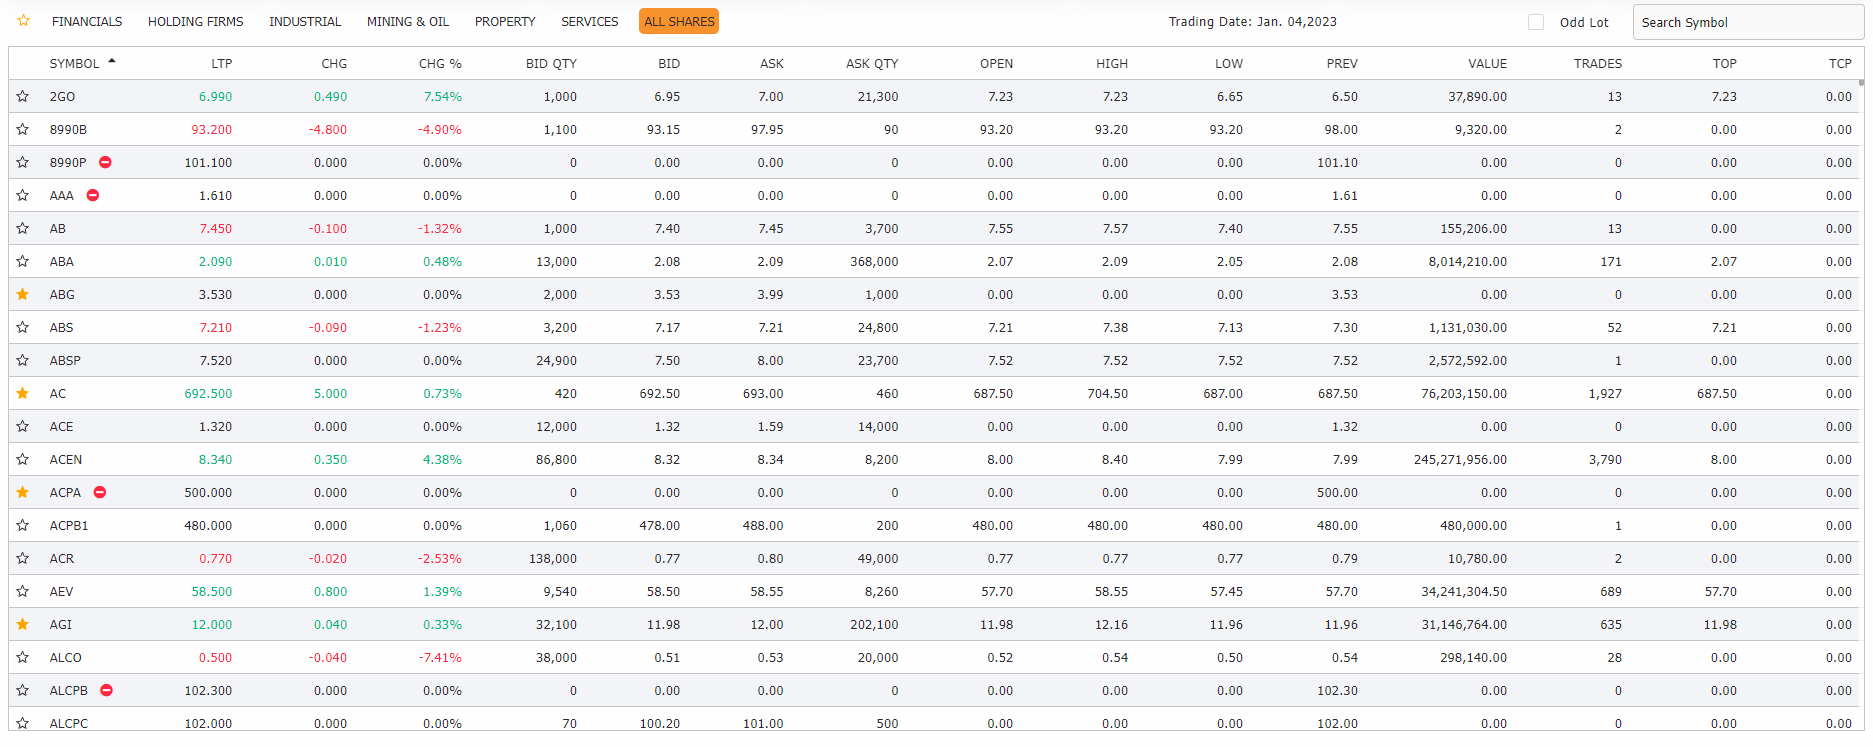
| MARKET SUMMARY |
|
|
|
Market Summary displays the current market data. The exhibited data can be filtered by index members, market segment, and a specific symbol. |
