How To Trade Using PSEConnect
|
Step 1: Go to app.pseconnect.com and LOGIN your account
|
|
|
|
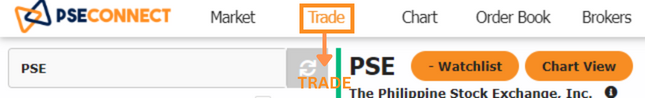
Step 2: Navigate to TRADE |
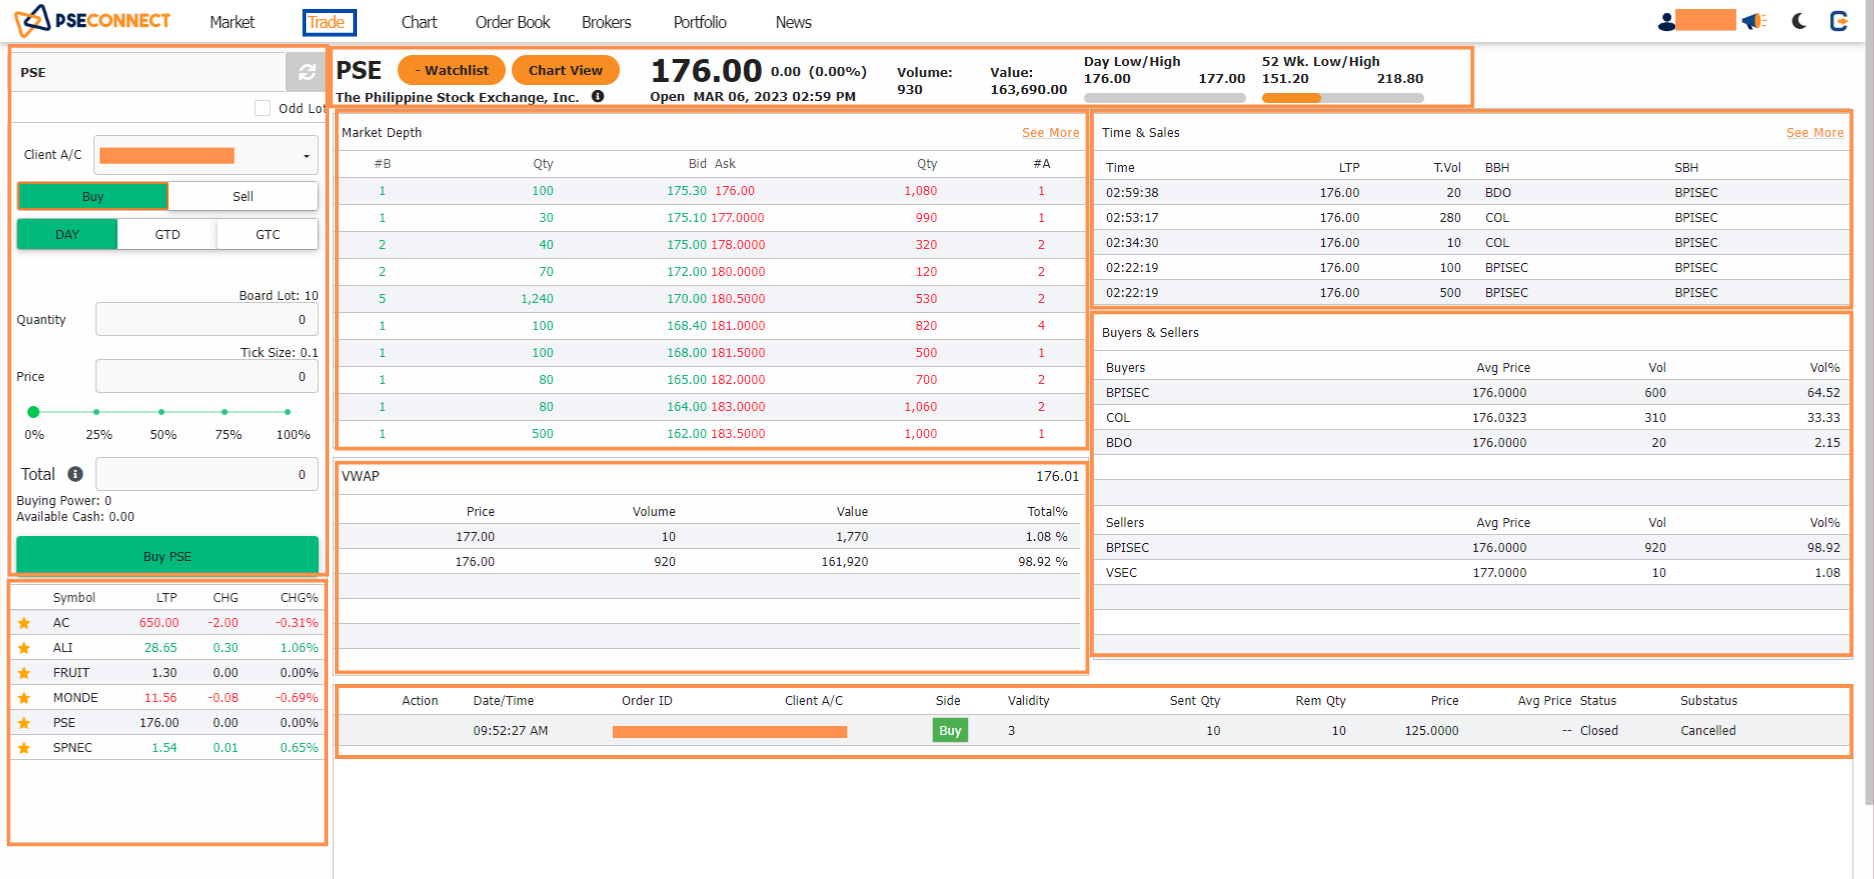
| Stock Information |
|
Stock Quote and Information displays the current doing price and stock summary information. To monitor different security stocks easily, multiple tabs can be created by clicking the ‘plus’ icon located at the upper left corner. |
| Time & Sales |
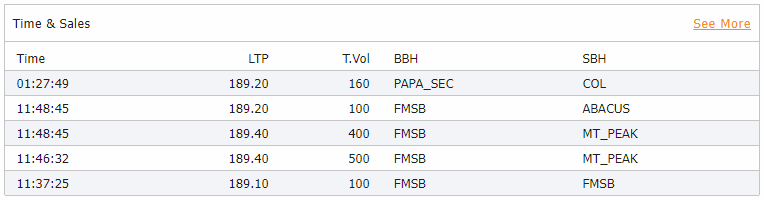
Time and Sales section shows the latest sales transacted during the day. It displays the time of transaction, traded price, total volume of the buyer brokers house, and the sellers broker house. |
|
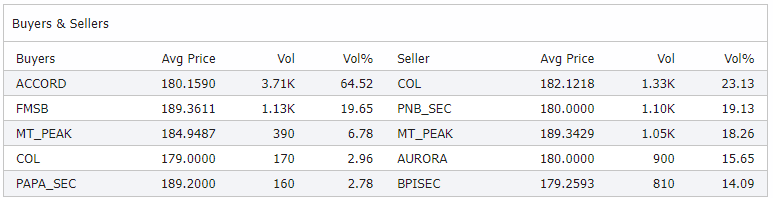
Buyers and Sellers |
|
Buyers and Sellers section shows the summary of average price, volume and volume change transacted by the broker
|
|
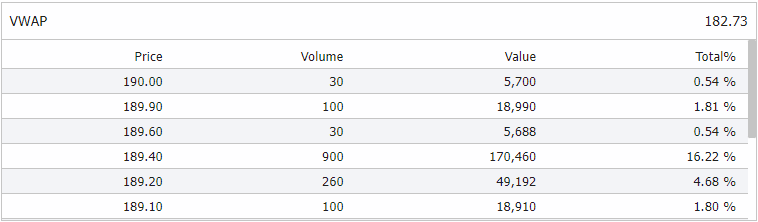
Aggregated by price |
|
Aggregated by price exhibits the summary of the selected stock price and its volume traded by the day. |
|
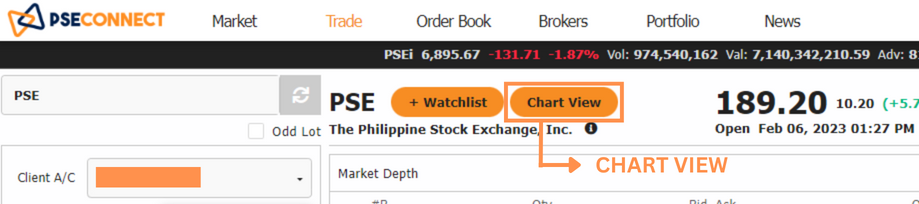
Chart View |
|
Chart View when clicked,displays the graphical representation of price and volume movements of the stock. The X-axis represents the time period while the Y-axis represents the price movement. To maximize the chart, click the ‘’ icon located at the upper left corner of the chart, this will redirect you to a new window displaying the stock chart in full window. |
|
Watchlist |
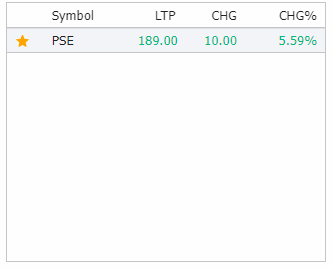 |
Watchlist displays the security that you added to your watchlist |
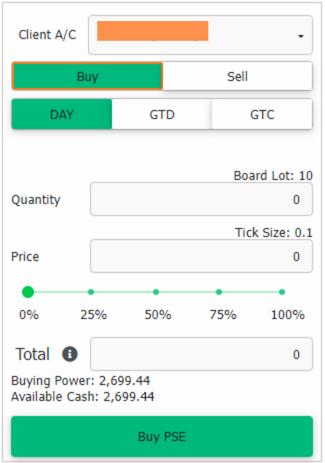
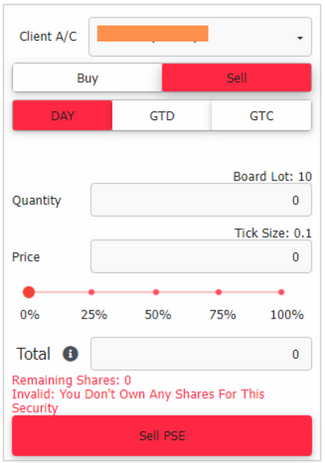
| Order Form |
|
Order Form is where you can buy and sell your stocks. A detailed explanation on how to use the order form will be provided in a separate post |
|
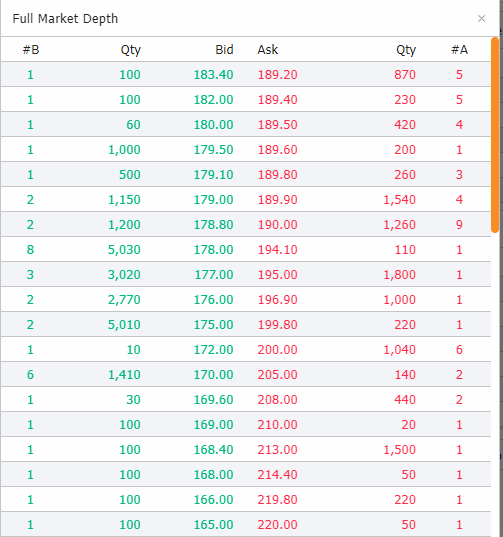
Market Depth |
|
Market Depth displays the current bid and ask positions of the selected stock. Values highlighted in red are the current bids, while values highlighted in green are the current offers. Clicking the ‘See More’ link located at the upper right corner will redirect you to a new page for a full list of bid and ask.
|
|
